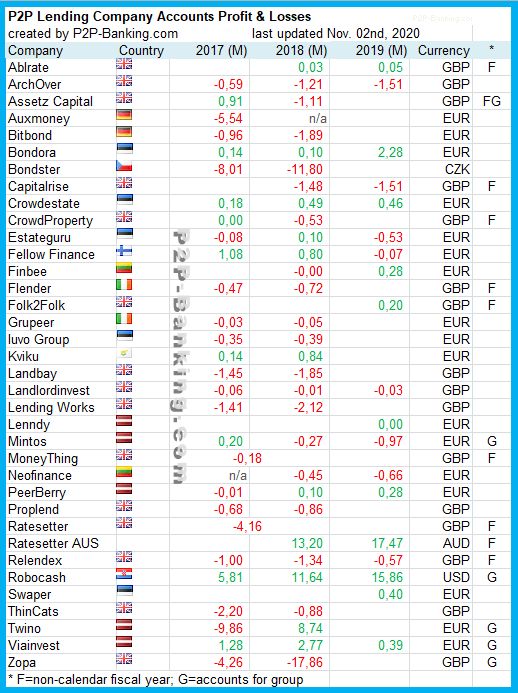
Which p2p lending companies made a profit and which did incur a loss in the previous year(s)? Why is this question important? One major risk for investors on p2p lending platforms is that the company running the platform becomes insolvent and is unable to continue to operate the marketplace. With the recent failure of 3 British p2p lending companies which fell in administration, the importance of the financial health of a p2p lending company for assessing the overall risk just got a visibility boost.
While it is normal that startups are making losses in the growth phase, that means they are dependent on raising new financing from existing or new shareholders over and over again until they reach breakeven. Please also note that profitable companies will likely reinvest most of the revenues in further growth so the aim of the startups is usually not to grow the profits but rather to increase lending volume and accelerate growth. Also keep in mind that while the company might have generated a profit in the stated year, it might carry a lot of debt that it used to fund the growth in previous years.
The following list of company results was compiled from public company registers and/or company accounts published on the company websites. Not all of the accounts are audited.
At this starting point the list is not very comprehensive, but I plan to add information for more p2p lending services and to update the information for subsequent years. You can help by emailing me information (accounts for last year(s) in English, German or French language and/or link, where they are published) on those companies that are not yet included in the table.

Table: Profits/losses of p2p lending companies (in million currency units) Source: own research. Please report any typos/inaccuracies.
In cases where there is a marketplace company (e.g. Zopa Limited) and a group company with wider activity above (e.g. Zopa Group Limited) and the figures are available for the group, I decided to use the figures for the group. My reasoning is that in order to gauge the financial risk, the group figures are more important, as should the group fail or fall into financial problems, it seems unlikely (but not impossible) that the underlying entity would survive the parent company. I received some email comments that this distorts the picture (e.g. Zopa Group Limited figures include the bank licensing / banking operation and therefore operate on a much larger scale than Zopa Limited which runs the p2p lending marketplace operation).
Links to the platforms listed in the table: Ablrate*. Archover*, Assetz Capital, Auxmoney*, Bitbond*, Bondora*, Bondster*, Capitalrise*, Crowdestate*, Crowdproperty*, Estateguru*, Fellow Finance*, Grupeer*, Iuvo Group*, Landbay*, Landlordinvest*, Lending Works*, Lenndy*, Mintos*, Neofinance*, Peerberry*, Proplend*, Ratesetter*, Relendex*, Robocash*, Swaper*, ThinCats*, Twino*, Viainvest*, Zopa*.