- analyse the data
- use some examples to show how volatile the prices of traded loan parts can be
- discuss some of the potential reasons for the inefficiency of the market
- conclude with my opinion.
The basics of the Bondora secondary market
Bondora (at that time Isepankur) launched the secondary market in March 2013.
Sellers can list any current and overdue loan parts for sale as long they are not 60+ days overdue. Loan parts stay listed until they are sold or cancelled by seller for a maximum of 30 days. Loan parts are traded at principal value. Any unpaid accrued interest, overdue interest, overdue principal and unpaid late charges are disregarded for the sales prices and will – provided the borrower pays up anytime after the transaction – cause a windfall profit for the buyer. The seller can impose a discount or markup on the principal. The discount ca go as low as -99% whereas the possible markup was limited to 5% until July 24th, 2014 and increased to a maximum of 40% thereafter.
If a transaction occurs Bondora charges the seller and the buyer a 1.5% transaction fee each.
Using the data download
The download file I used had 159.7K data lines. This includes 66K cancelled listings and 35K failed listings. For the further analysis I used the 59.4K successful transactions.
On first look the market seems efficient: 8.3% of loan parts sold within 15 minutes. 20% sell within the first hour. But I felt the aggregate data might not tell the full story and I started to look how pricing (discount and markups) developed on individual loans.
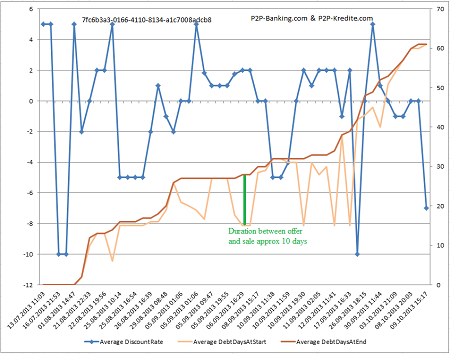
First example is a 10,000 Euro A900 loan originated to an Estonian borrower on May 2013. This loan defaulted in October 2013 which ended the possibility to trade loan parts. In this short timespan 62 loan parts with a principal value of 1,748 Euro were traded (that’s out of 356 that were listed).
I took the transactions and spread them out over time on the x-axis and graphed the discount rate (blue line, left y-axis).

Chart 1: Example loan 1 (see larger image).
As you can see the price fluctuates widely from -10% discount to 5% markup, while the basic condition – the loan was overdue since begin of August did not change. I also added the orange line that shows how many days the loan was overdue when the seller listed it (DebtDaysAtStart) and the red line that shows how many days the loan was overdue when the transaction actually took place (DebtDaysAtEnd). At those times where the loan was overdue the distance between the two lines shows how long it took for a listed loan part before it sold (see green mark as example).
Let’s look at another example

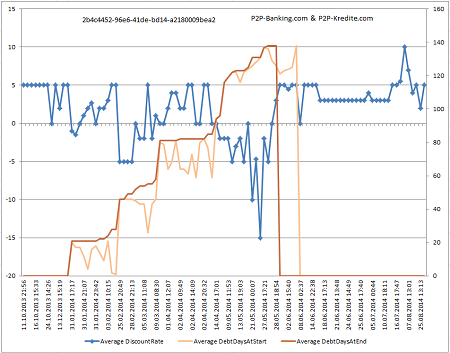
Chart 2: Example loan 2. Loan for 9,000 Euro originated in August 2013 to an A1000 Estonian borrower (see larger image).
This is one of the most actively traded loans. 115 loan parts for a principal value of 6,705 Euro have been traded. That means more than two thirds of the loan amount has exchanged owning investor.
Again the discount rate fluctuates wildly between -15% and +10%. On May 28th, 2014 this loan was rescheduled and then listed as green/current on the marketplace. From this day for a few trades the orange line ‘lags’ before following the drop of the red line. That means that here loan parts were sold that were put on sale while the loan was still overdue before the reschedule.
Let’s look at volumes traded over time for this loan.
Chart 3: Example loan 2. Trade volume in Euro (see larger image).
The trade volume for this loan peaks after it turned temporarily current after making payments on Feb., 28th and April, 1st. This is a common pattern on the Bondora secondary market. Within minutes and hours of a loan paying the overdue amount and turning current again, lots of loan parts are bought (in this case mostly at par or at slight discount).
Chart 4: Example loan 2. Time in hours it took for loan parts to sell (see larger image).
There is no consistent pattern for how long it took to sell loan parts of this loan. While a few sold very fast, others took more than 480 hours (=20 days) before they were sold.
I looked at charts of dozens of individual loans. The above selected examples are in no way extremes. An extreme example would be loan 588cb5c4-74f9-412b-9a76-a1b001339cb2, where discount rate fluctuated between -99% and +40%. One thing heavily traded loans have in common, is that they have been overdue at least once. Trade volume of loans that were always on time very seldomly surpasses 1,000 Euro (most active example b6d2620e-7c57-4533-a13a-a2c5017562aa).
In my view the large number of unsold parts on the secondary market and especially the high fluctuations of discount and markups are clear indicator of market inefficiency on the current Bondora secondary market. This becomes apparent too when looking on multiple sales offers for the same loan on the market at any time. At the time of writing this article, there are 13 loan parts for borrower BO2A525KA on sale which is currently overdue. The prices range from 15% discount to 5% markup.
Possible reasons influencing the current situation are:
- Sellers lack any guidance at which discount/markup a sale for a particular loan part is probable (Bondora could for example do a tooltip after the seller selected a discount which says ‘at or above this discount 3 loan parts sold in the last 7 days‘)
- Sellers have no option to automatically delist parts when they turn current. Some investors shy away from offering overdue parts at discount or par, because if they turn current they are snapped up and only those that don’t turn current and go into default stay in their portfolio (adverse selection)
- The filters for buyers on the secondary market lack desirable functionality and do not enable any automatic monitoring and buying. This leaves the vast majority of investors with suboptimal abilities to find the loans they would like to buy
- Scarcity of most-wanted loan types (EE A1000) on the primary market drives pricing for these loans on the secondary market
In my opinion the current situation favours those very few investors that use tools to partly automate monitoring, analysis and transactions on the secondary market. As the graphs above show the short time fluctuations of pricing offer a chance for active short-term trading of parts. Buying and selling a part results in 3% transaction fee, so any spread achieved above 3% will result in direct profit (before tax).
Investors have often asked for better sorting and filtering on the secondary market, but this functionality is still not there. The data download delivers lots of useful raw data – even more could be added as there is no download for the parts currently on sale.
However the average investor needs tools that support him in making use of this data. Are you an investor that has found an innovative way to (partly) automate trading on Bondora? I’d love to hear how you do it.
