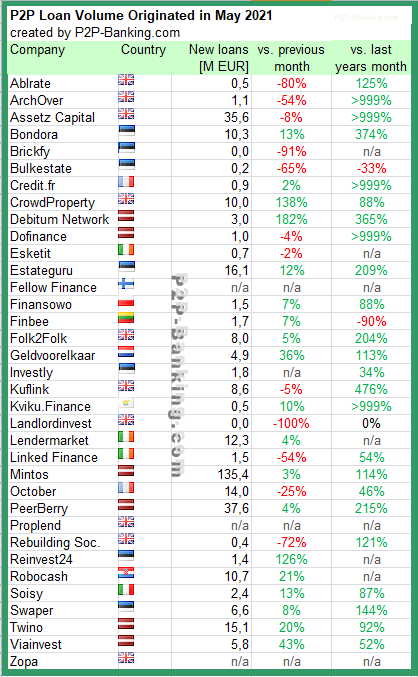
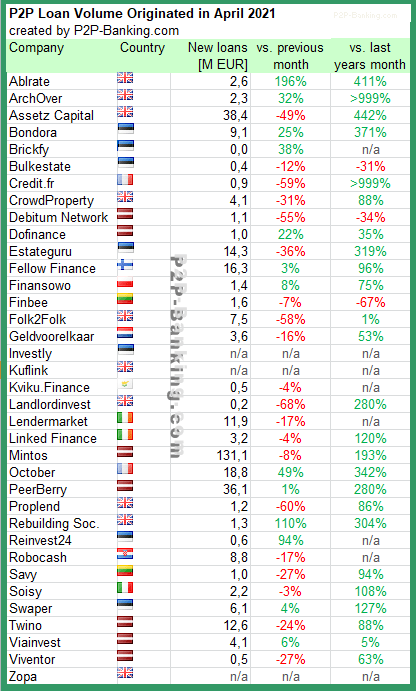
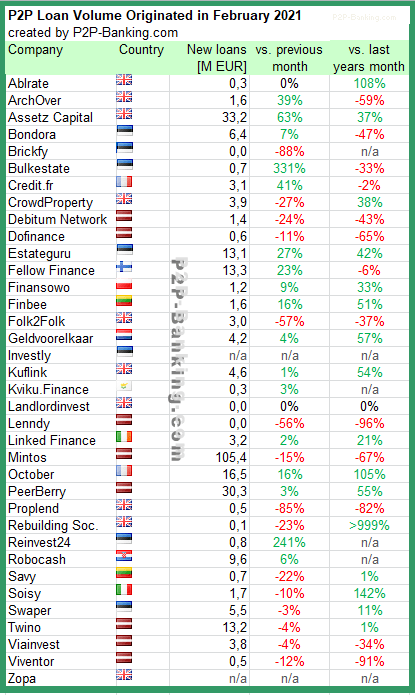
The table lists the loan originations of p2p lending marketplaces for last month. Mintos* leads ahead of Peerberry* and Assetz Capital*. The total volume for the reported marketplaces in the table adds up to 302 million Euro. I track the development of p2p lending volumes for many markets. Since I already have most of the data on file, I can publish statistics on the monthly loan originations for selected p2p lending platforms.
I have delisted Ratesetter as they have not been accepting new investors for several months and it seems unlikely to me that they will reopen for new retail investors.
Table: P2P Lending Volumes in January 2021. Source: own research Note that volumes have been converted from local currency to Euro for the purpose of comparison. Some figures are estimates/approximations.
The table lists the loan originations of p2p lending marketplaces for last month. Mintos* leads ahead of Assetz Capital* and Ratesetter*. The total volume for the reported marketplaces in the table adds up to 359 million Euro. I track the development of p2p lending volumes for many markets. Since I already have most of the data on file, I can publish statistics on the monthly loan originations for selected p2p lending platforms. This month I added Brickfy*.
Table: P2P Lending Volumes in December 2020. Source: own research Note that volumes have been converted from local currency to Euro for the purpose of comparison. Some figures are estimates/approximations.
The table lists the loan originations of p2p lending marketplaces for last month. Mintos* leads ahead of Ratesetter and Peerberry*. The total volume for the reported marketplaces in the table adds up to 261 million Euro. I track the development of p2p lending volumes for many markets. Since I already have most of the data on file, I can publish statistics on the monthly loan originations for selected p2p lending platforms.
Table: P2P Lending Volumes in November 2020. Source: own research Note that volumes have been converted from local currency to Euro for the purpose of comparison. Some figures are estimates/approximations.
The table lists the loan originations of p2p lending marketplaces for last month. Mintos* leads ahead of Ratesetter* and Peerberry*. The total volume for the reported marketplaces in the table adds up to 289 million Euro. I track the development of p2p lending volumes for many markets. Since I already have most of the data on file, I can publish statistics on the monthly loan originations for selected p2p lending platforms. This month I have added Reinvest24* and Robocash*.
Table: P2P Lending Volumes in October 2020. Source: own research Note that volumes have been converted from local currency to Euro for the purpose of comparison. Some figures are estimates/approximations.
CrowdProperty was set up in 2013 because we personally felt the pain of raising finance for our property projects through decades of investing in, and developing, property ourselves. The three founders have 75 years’ experience of property investing and developing between us, meaning exceptional expertise in exactly the asset class we’re lending against). So, we set ourselves the challenge of building the best SME property development lender in the market, serving the customer needs we intimately knew better.
Traditional sources of finance have failed quality property professionals looking to undertake quality property projects for years. Large housebuilders feel this pain less but there are a finite number of large sites in this country to develop. Therefore, SME housebuilders are critically important but housing output from this segment fell from one third of UK output in 2008 to just 10% by 2017.
As a country, we need to unlock the power of entrepreneurial SME developers. Whilst Government initiatives around planning and taxation help, by far the biggest barrier is funding, according to 42% of respondents from our SME developer survey last year (which was the largest ever undertaken amongst this community).
This is exactly where our deep expertise lies, where our focus has always been, and where there’s greatest pain in the market. Having now built the best lender in the market, as property finance by property experts, we work in partnership with borrowers by adding value throughout their projects, and therefore deliver a better deal for all – our borrowers, our lenders, the under-supplied housing market and spend in the UK economy.
This is all crucial for CrowdProperty lenders: quality property professionals with quality property projects want to work with CrowdProperty, which has driven £3.8bn of direct project applications. From these, we have expertly curated £100,000,000 of lending – i.e. less than 3% conversion rate – across over 240 loans and 170 projects. This is testament to our tough criteria, rigorous due diligence and knowledge that a long-term lending business is only built through quality and track record, which is at the heart of all that we do.
As others have temporarily closed to retail investors, stopped allowing withdrawals, cut interest rates, introduced lender fees or even had regulatory permissions withdrawn, we have been able to continue funding quality projects which are ready to proceed, with naturally tighter criteria. We have further step-changed our reputation in the market on the borrower-side and direct applications are now c.£200,000,000 per month, with an ever-increasing quality mix.
We believe in data transparency to best inform investor decision making (illustrated by our award-winning statistics page and independent performance verification by Brismo). Resourcing our business strongly with a team of 32 and having a non-London base gives us considerable fixed cost advantage, savings from which we’re able to invest in expertise and further development of our in-house developed proprietary technology platform.
Our proposition is underpinned by an in-house developed proprietary technology platform for efficiencies of underwriting, data analytics, workflows, payments, funding, monitoring and reporting, coupled with decades of SME property development expertise for effectiveness. We have leading third party data, raw data feeds and internal analytics benefiting from nearly £4bn of applications. Property Director Andrew Hall has over 35 years’ experience as a qualified RICS surveyor, through multiple cycles, and is the leading expert in the team that validates deals that go to the investment committee. We have developed a rigorous due diligence process through decades of hands-on expertise in exactly the asset class being lent against. CrowdProperty is directly authorised and regulated by the FCA and an HMRC approved ISA manager.
If an investor would have invested the same amount into every CrowdProperty loan since 2018, what yield would he have achieved by now?
An XIRR of 8.15% (since launch it is 8.74%)**. We’ve now paid back £50,000,000 in capital and interest to lenders with an average rate of return of 8.74% p.a. and a perfect, 100% capital and interest payback track record. CrowdProperty also provides a tax-wrapper for UK-based investors lending through the CrowdProperty Innovative Finance ISA, SSAS pensions and SIPP pensions, all of which are very popular and significantly enhance effective returns due to the tax shields.
CrowdProperty loans are secured by a first charge. An important factor is appropriateness of the price set during valuation. How certain are you that valuations are in line with the market?
Indeed, all CrowdProperty loans are first-charge secured on the property assets, meaning that not only are CrowdProperty loans first in line to be paid back, but also CrowdProperty is able to be in control of any recoveries action, which is often overlooked in importance.
Our first charge security exposure averages provide a strong risk / reward proposition considering the returns offered by CrowdProperty:
Loan to value (LTV, or initial funds release relative to RICS-assessed market value) of 59.7% (55.9% in the 2020 cohort)
Loan to gross development value (LTGDV) 53.6% (excluding interest) and 58.5% (including interest)
The key factor is clearly the assessment of ‘V’ (value) in the above – both current value and end-product value – plus sensitivities of this critical data point to security and stability of the project. The ‘V’ is what we scrutinise most in the numbers, especially at the moment. We appoint societal-bound RICS surveyors with a long list of appointment criteria to conduct valuations on each and every project. This report is talked through with the surveyor and then validated with both leading internal and leading third-party data sets, used as inputs to our in-house expert-led analysis of the property asset in question, with a particular focus around understanding the nuances of the property, project and local market. In parallel, we are assessing the borrower and team in terms of not only their capabilities / experience but also their ambitions, motivations and commitment to this project and their professional property journey. Furthermore, project costings are internally validated by our expert team, supported by benchmark costings and a very detailed baseline Independent Monitoring Surveyor report and through the projects themselves, drawdowns are only ever made in arrears to project progress as formally assessed by the IMS.
CrowdProperty is entirely focused on funding quality property projects being undertaken by quality property professionals serving domestic under-supplied demand in liquid markets throughout the UK at mainstream, affordable price points, where there is enduring demand.
Are property prices going up or down? What factors do currently impact the UK market and where do investors find good (free?) market data to monitor the trend?
It’s been well documented over the past few months that UK property prices are rising, pushing house prices to a record high – the average price for property in UK stood at £315,150 in October 2020. This is being driven by Government stimulus such as the short-term reduction in property purchase stamp duty, but is also set in the context of relatively low growth in the last 3-5 years, real pricing levels that are the same as many points through the last 15 years and historically low transaction levels, resulting in pent up demand for those looking to get onto the property ladder and those wishing to move up / trade down.
We run extensive resilience analyses on both the market and our existing book at very granular levels, running both historical and theoretical scenarios. It’s helpful to reflect back on most recent shocks to the market (which are albeit driven by different macro-economic situations) and understand how trends preceding, during and after those compare to the current situation. We look at the market in a deconstructed way, influenced by what we have seen in the past. Firstly, we think about whether there is a correction waiting to happen given recent growth. Next, we think about the outlook for supply and demand. Thirdly, we carefully watch all activity indicators and finally we ensure that our focus, lending criteria and security are appropriate to uphold the high-quality lending we offer.
We believe that this shock will not lead to the correction of excessive growth that has been long-awaited. Examining he Nationwide House Price Index since 1975, one can see that both 89/90 and 07/08 experienced long periods of housing market growth before economic shocks drove double-digit percentage declines, taking years to recover. At first glance, one might think the signs are here again.
But this is where it is also important to examine real (inflation adjusted) as well as nominal growth – i.e. taking the effects of inflation out of the nominal (unadjusted for inflation) data. Real (RPI adjusted) growth shows a very different story to the nominal picture – average real values today are 16% below the 2007 peak, have been pretty much flat since early 2015 and are currently at the same real value as in 2010 and 2005. This is a very different context to the extended periods of high growth in values that led into the 89/90 and 08/09 market falls.
The balance of supply and demand for housing is again very different to 08/09. Back then, many needed to sell (including banks who adopted wholesale repossess and sell policies) and very few could buy (given the protracted state of the debt markets which was the underlying shock) or were prepared to buy (due to long-term prospects of the debt markets holding back recovery). Whilst the UK’s Job Retention Scheme has undoubtedly helped many households, as that is unwound, there is clearly significant uncertainty around job security and personal finances, and dwindling demand could be expected.
Whilst first-time buyers have been the driving force of the housing market for the last decade, Zoopla’s latest House Price Index suggests that homeowners are becoming increasingly active in the market. This makes sense as “equity-rich homeowners seek more space and a change in location”, while first-time buyers are being impacted by restricted mortgage availability, tighter lending criteria and growing economic uncertainty. Whilst 95% LTV high street owner-occupier mortgages aren’t back yet, in its analysis of the Prime Minister’s speech, Rightmove suggests that the government could be looking to tackle this by bringing back 95% mortgages as part of the effort to “turn generation rent into generation buy”.
On the supply-side, whilst unfortunately there will be many more probate listings this year, there will be a greater decrease in construction completions in 2020, which has been under-supplying the market for decades (part of the reason that CrowdProperty exists). As demand continues to outweigh supply, the market is seeing a 2.6% annual growth rate in UK house prices despite the economic backdrop according to Zoopla. Indeed, Nottingham and Manchester are recording annual house price growth of c. 4% alongside Leeds, Edinburgh, Leicester, Liverpool, Cardiff, and Sheffield. Rightmove’s data shows that searches across September increased 53% on average across the ten biggest cities, but there has also been an uplift in demand for smaller communities as buyers seek out larger spaces – analysts named nine areas where searches have doubled across Surrey, Somerset, Gloucestershire, Berkshire, Dorset, Kent and Suffolk which all have a population of under 11,000. Continue reading →
The table lists the loan originations of p2p lending marketplaces for last month. Mintos* leads ahead of Ratesetter* and Peerberry*. The total volume for the reported marketplaces in the table adds up to 237 million Euro. I track the development of p2p lending volumes for many markets. Since I already have most of the data on file, I can publish statistics on the monthly loan originations for selected p2p lending platforms. This month I have added Kuflink*.
Table: P2P Lending Volumes in September 2020. Source: own research Note that volumes have been converted from local currency to Euro for the purpose of comparison. Some figures are estimates/approximations.