This post is based on the findings, which German investor ‘Bandit55555’ posted in his own blog p2p-anlage.de. ‘Bandit55555’ is the investor at Bondora with the highest ROI (at least that I am aware of): He calculates his XIRR ROI to be 35.4%, while Bondora displays 57.5% for his portfolio. He achieves that by very diligently using the public download data supplied by Bondora as a basis for his investing and trading. In fact he even developed his own scoring system based on the data.
The secondary market of p2p lending marketplace Bondora was introduced in March 2013. Right now more than 24,400 loan parts are on sale. Using the data Bondora makes publicly available for download the following charts were created.
Number of loans sold on Bondora’s secondary market. Source p2p-anlage.de, reproduced here with permission. Continue reading →
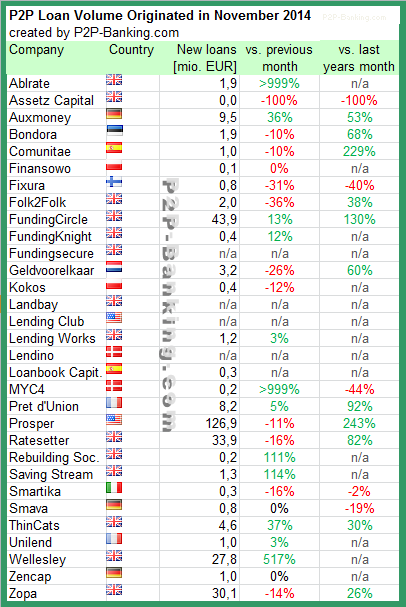
October was overall a good month for p2p lending services. Especially Zopa did grow and closed a bit of the gap to the 2 other UK p2p marketplaces . Prosper reached a total volume of 2 billion US$ originated since inception. I added one more service. I do monitor development of p2p lending figures for many markets. Since I already have most of the data on file I can publish statistics on the monthly loan originations for selected p2p lending services.
Table: P2P Lending Volumes in October 2014. Source: own research Note that volumes have been converted from local currency to Euro for the sake of comparison. Some figures are estimates/approximations.
Notice to p2p lending services not listed: If you want to be included in this chart in future, please email the following figures on the first working day of a month: total loan volume originated since inception, loan volume originated in previous month, number of loans originated in previous month, average nominal interest rate of loans originated in previous month.
September was a very good month for most p2p lending services. The major UK p2p lending services grew strongly with Ratesetter surpassing 30 million GBP originated. I added the new UK service Ablrate which originated the first two loans. I do monitor development of p2p lending figures for many markets. Since I already have most of the data on file I can publish statistics on the monthly loan originations for selected p2p lending services.
Table: P2P Lending Volumes in September 2014. Source: own research Note that volumes have been converted from local currency to Euro for the sake of comparison. Some figures are estimates/approximations.
Notice to p2p lending services not listed: If you want to be included in this chart in future, please email the following figures on the first working day of a month: total loan volume originated since inception, loan volume originated in previous month, number of loans originated in previous month, average nominal interest rate of loans originated in previous month.
In October 2012 I started p2p lending at Bondora. Since then I periodically wrote on my experiences – you can read my last blog article here. Since the start I did deposit 14,000 Euro (approx. 17,800 US$). My portfolio is very much diversified. Most loan parts I hold are for loan terms between 36 and 60 months. Together the loans add up to 17,924 Euro outstanding principal. Loans in the value of 2,084 Euro are overdue, meaning they (partly) missed one or two repayments. 1,327 Euro principal is stuck in loans that are more than 60 days late. I already received 7,608 Euro in repaid principal back (which I reinvested).
Chart 1: Screenshot of loan status
At the moment I have 430 Euro in bids in open market listings and 394 Euro cash available. Continue reading →
One advantage of Bondora is that this p2p lending market makes a lot of data available for download to investors. Recently Bondora added data on ‘Secondary market transaction history‘. In this article I will
analyse the data
use some examples to show how volatile the prices of traded loan parts can be
discuss some of the potential reasons for the inefficiency of the market
Sellers can list any current and overdue loan parts for sale as long they are not 60+ days overdue. Loan parts stay listed until they are sold or cancelled by seller for a maximum of 30 days. Loan parts are traded at principal value. Any unpaid accrued interest, overdue interest, overdue principal and unpaid late charges are disregarded for the sales prices and will – provided the borrower pays up anytime after the transaction – cause a windfall profit for the buyer. The seller can impose a discount or markup on the principal. The discount ca go as low as -99% whereas the possible markup was limited to 5% until July 24th, 2014 and increased to a maximum of 40% thereafter.
If a transaction occurs Bondora charges the seller and the buyer a 1.5% transaction fee each.
Using the data download
The download file I used had 159.7K data lines. This includes 66K cancelled listings and 35K failed listings. For the further analysis I used the 59.4K successful transactions.
On first look the market seems efficient: 8.3% of loan parts sold within 15 minutes. 20% sell within the first hour. But I felt the aggregate data might not tell the full story and I started to look how pricing (discount and markups) developed on individual loans.
First example is a 10,000 Euro A900 loan originated to an Estonian borrower on May 2013. This loan defaulted in October 2013 which ended the possibility to trade loan parts. In this short timespan 62 loan parts with a principal value of 1,748 Euro were traded (that’s out of 356 that were listed).
I took the transactions and spread them out over time on the x-axis and graphed the discount rate (blue line, left y-axis).
As you can see the price fluctuates widely from -10% discount to 5% markup, while the basic condition – the loan was overdue since begin of August did not change. I also added the orange line that shows how many days the loan was overdue when the seller listed it (DebtDaysAtStart) and the red line that shows how many days the loan was overdue when the transaction actually took place (DebtDaysAtEnd). At those times where the loan was overdue the distance between the two lines shows how long it took for a listed loan part before it sold (see green mark as example). Continue reading →
In August Prosper, Bondora and Thincats showed big growth of newly originated loan volume. For most other services it was a slow month. I added one more new service to the table. I do monitor development of p2p lending figures for many markets. Since I already have most of the data on file I can publish statistics on the monthly loan originations for selected p2p lending services.
Table: P2P Lending Volumes in August 2014. Source: own research Note that volumes have been converted from local currency to Euro for the sake of comparison. Some figures are estimates/approximations.
Notice to p2p lending services not listed: If you want to be included in this chart in future, please email the following figures on the first working day of a month: total loan volume originated since inception, loan volume originated in previous month, number of loans originated in previous month, average nominal interest rate of loans originated in previous month.