Review of My Bondora Loan Portfolio After Q4/2014

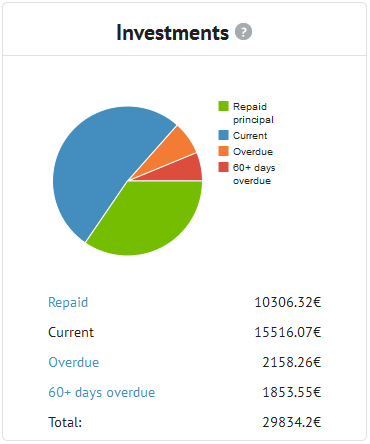
In October 2012 I started p2p lending at Bondora. Since then I periodically wrote on my experiences – you can read my last report here. Since the start I did deposit 14,000 Euro (approx. 17,000 US$). My portfolio is very diversified. Most loan parts I hold are for loan terms between 36 and 60 months. Together the loans add up to 19,528 Euro outstanding principal. Loans in the value of 2,158 Euro are overdue, meaning they (partly) missed one or two repayments. 1,853 Euro principal is stuck in loans that are more than 60 days late. I already received 10,316 Euro in repaid principal back – this figures includes loans Bondora cancelled before payout. I reinvested all repayments.


Chart 1: Screenshot of loan status

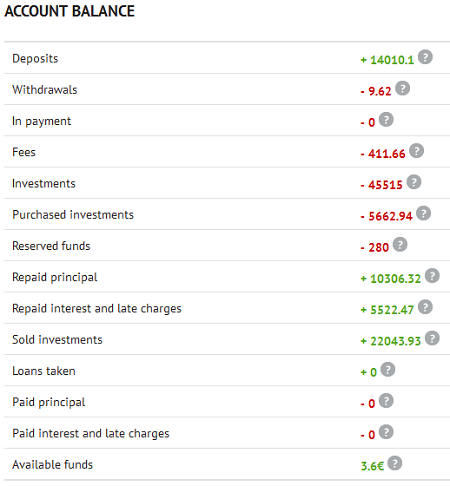
At the moment I have 280 Euro in bids in open market listings and 3 Euro cash available.


Chart 2: Screenshot of account balance

Return on Invest

Currently Isepankur shows my ROI to be over 27.56%. In my own calculations, using XIRR in Excel, assuming that 30% of my 60+days overdue and 15% of my overdue loans will not be recovered, my ROI calculations result in 25.0%. Continue reading

Bondora Ratings Create a Single Eurozone Lending Marketplace

This is a guest post by Pärtel Tomberg, CEO of Bondora.

This month we started the roll-out of Bondora Ratings, a loan application rating system based on the proprietary credit scoring model, with the aim to bring better predictability and consistency of the returns for investors active on Bondora platform.

Our initial aim for developing a credit scoring model was to bring the best banking practices to peer lending. Banks might have failed at providing people with affordable credits, but they have done a few things right, such as developing strong credit scoring models, that have helped them generate premium returns for their investors. With Bondora Ratings we are bringing credit scoring model to individual investors so they could maximize their returns in the same way banks do.

Being a platform that facilitates the exchange between lenders and borrowers, we believe it is our responsibility to bring the best practices, such as credit scoring, to peer lending; thus, making it an effective, efficient and mutually beneficial process for both parties. Eventually, Bondora Ratings will allow credible borrowers get a better rate for a loan, while investors will receive a predictable return level.

On top of bringing banking practices to peer lending, we saw a need for a simple, transparent and unified way to represent the risks and potential returns associated with a particular loan. Until recently, our investors used their own sophisticated models to evaluate the risks and plan their investments at Bondora. We have supported the initiative by offering a wide range of filters and providing extensive data export sets, and we will continue to support those investors in the future by providing a Trading API.

However, as the platform grows, we see an increasing inflow of investors that do not have a need or desire to engage into extensive number crunching. The historic performance of peer lending platforms, and Bondora in particular, indicates that peer lending provides premium returns compared to other assets classes and investors want a simple and easy way to earn those premium returns. Continue reading

Decision Trees – Using The Available Data to Identify Lending Opportunities on Bondora – Part 3

This is part 3 of a guest post by British Bondora investor ‘ParisinGOC’.

Read part 1 and part 2 first.

Investments Decisions using the Tree(s)

Using the Data

Using the output is as simple as looking at the visualisation to see how the Decision Tree splits down from the Root Node and comparing this with a Bondora loan application that I see as a potential target for investment. (Illustration 2 and Illustration 3) At the end of the set of branches that I follow dependant upon the data in the loan application, I end up at a “leaf node”- the end of the tree. (Illustration 4)  This node simply states how many previous loans match the one I am looking at, showing how many of the previous loans defaulted and how many have not.

I treat the Decision Tree as the first step in choosing whether to invest. If the performance record of previous loans like the one I am now considering suggest a default rate of 5% or less, I look further into the loan application. Continue reading

Decision Trees – Using The Available Data to Identify Lending Opportunities on Bondora – Part 2

This is part 2 of a guest post by British Bondora investor ‘ParisinGOC’.

Read part 1 first.

Data Mining the Bondora data.

The initial process.

To help understand the specific data cleansing that the Bondora Data Set needed, I first made use of the RapidMiner metadata view – a summary of all the attributes presented to the software – showing Attribute name, type, statistics (dependant on type, includes the least occurring and most occurring values, the modal value and the average value), Range (min, max, quantity of each value for polynominal and text attributes) and, most critically, “Missings” and “Role”.

“Role” is the name given by RapidMiner to the special attributes that are needed to allow certain operations. In my case, the Decision Tree module needed to know which Attribute was the “Target”, that is the attribute that is the focus of the analysis and to which the Decision Tree has to relate the other attributes in its processing.  My “Target” was the “Default” attribute – a “Binominal” (called as such by RapidMiner and meaning an attribute with just 2 values) attribute – 1 if the loan had defaulted, 0 if not.

“Missings” is easy – this is the number of times this attribute has no valid value. For example, my import of the raw Bondora input data has 150 attributes.  Only half of these attributes have no missing values.  The remainder have between 13 and 19132 rows with missing values from a data set of 20767 rows.

To know whether these “missings” would impact my analysis, I needed to get to know the data in more detail.

I knew that Bondora had started to offer loans in Finland in summer 2013 with Spain following in October of that year and Slovakia in the first half of 2014.

I therefore decided not to bother with any loan issued prior to 2013. Continue reading

Decision Trees – Using The Available Data to Identify Lending Opportunities on Bondora – Part 1

This is a guest post by British Bondora investor ‘ParisinGOC’.

Introduction

Financial institutions across the world have many ways of assessing whether a loan is worth making.  A simple search on the web reveals that many use Data Mining.  More specifically, “Decision Trees” are a particular tool within Data Mining that has been analysed and I quickly found at least 2 papers (Mining Interesting Rules in Bank Loans Data and Assessing Loan Risks: A Data Mining Case Study) amongst many pointing in this direction.

Having had some experience of Data Mining in a financial environment, I believed I could use these same techniques in my own P2P lending which, after over 12 months activity, I felt could be improved.

In this document, I explore the use of the freely available Data Mining Software “RapidMiner” and its Decision Tree capabilities when applied to the data available to investors from Bondora, a peer-to-peer (P2P) lending site.

Bondora

Bondora is a P2P lending site based in Estonia that “unites investors and borrowers from all corners of the world”, allowing investors to invest funds to satisfy advertised borrowing needs.

Fundamentally, Bondora also provides comprehensive data to investors, allowing detailed data downloads of the individual loans held by the investor, as well as data on every application made to Bondora (originally known as Isepankur) since the first application on 21st February, 2009.

It is the complete Bondora data set that I have used as the raw data for analysis as it is the best data available to find out which potential borrowers are the right match to the potential lenders.  Only if enough lenders feel that a loan application is worth investing in will the loan be fulfilled.  Self-selection is taking place in both elements of the loan fulfilment and this data is the result of that interaction.

Also shown in this data are some elements of loan performance post-drawdown.  Crucially, it shows those loans that subsequently defaulted (failed to make any payments for a period in excess of 60 days).  Although Bondora will chase the debt on behalf of the investor and have a track record of some success, there is no guarantee that the investment, or any part of it, will be returned.

Decision Trees

www.investopedia.com/terms/d/decision-tree.asp states: A schematic tree-shaped diagram used to determine a course of action or show a statistical probability.

In this case, I am using the data provided by Bondora on all its previous applications to reveal how the resulting loans that share similar characteristics have performed.

Specifically, I am using this data to show the percentage of those previous loans that have defaulted and using this to indicate how a similar, new application may perform should the application succeed in attracting enough investors.

In other words, I am using past performance data to show how future investments may perform – I feel sure I have seen this phrase somewhere before! Continue reading

International P2P Lending Services – Loan Volumes November 2014

November was a month of mixed results for the listed p2p lending services. Some grew, some had a small decline in newly originated loan volume this month. Ratesetter crossed a total volume of 400 million GBP originated since inception. Ablrate profited from the deal with the first institutional investor, which boosted volume. I added one more service.  I do monitor development of p2p lending figures for many markets. Since I already have most of the data on file I can publish statistics on the monthly loan originations for selected p2p lending services.


Table: P2P Lending Volumes in November 2014. Source: own research
Note that volumes have been converted from local currency to Euro for the sake of comparison. Some figures are estimates/approximations.

Notice to p2p lending services not listed:
If you want to be included in this chart in future, please email the following figures on the first working day of a month: total loan volume originated since inception, loan volume originated in previous month, number of loans originated in previous month, average nominal interest rate of loans originated in previous month.