In October 2012 I started p2p lending at Bondora. Since then I periodically wrote on my experiences – you can read my last report here. Since the start I did deposit 14,000 Euro (approx. 17,000 US$). My portfolio is very diversified. Most loan parts I hold are for loan terms between 36 and 60 months. Together the loans add up to 19,528 Euro outstanding principal. Loans in the value of 2,158 Euro are overdue, meaning they (partly) missed one or two repayments. 1,853 Euro principal is stuck in loans that are more than 60 days late. I already received 10,316 Euro in repaid principal back – this figures includes loans Bondora cancelled before payout. I reinvested all repayments.
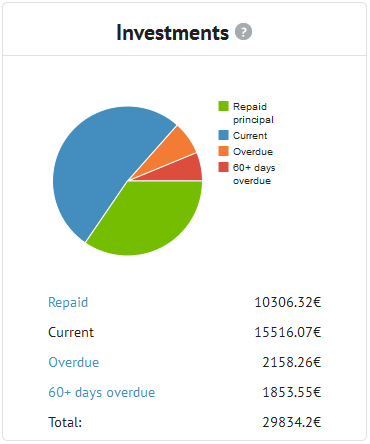
Chart 1: Screenshot of loan status
At the moment I have 280 Euro in bids in open market listings and 3 Euro cash available.
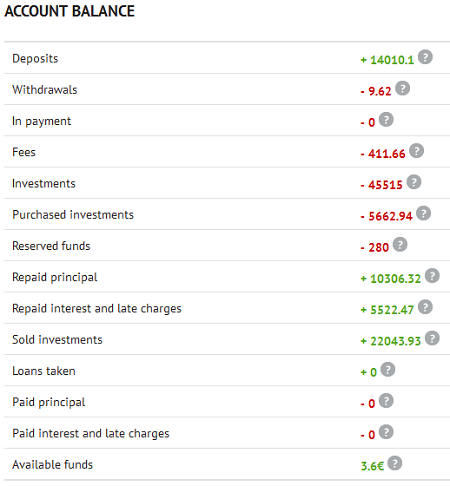
Chart 2: Screenshot of account balance
Return on Invest
Currently Isepankur shows my ROI to be over 27.56%. In my own calculations, using XIRR in Excel, assuming that 30% of my 60+days overdue and 15% of my overdue loans will not be recovered, my ROI calculations result in 25.0%.
New scoring system and early impact
On Dec. 8th Bondora announced that they will launch a new credit scoring model which assigns scores based on more criteria than in the past in order to better gauge and price risks (see related guest article by Bondora’s CEO).
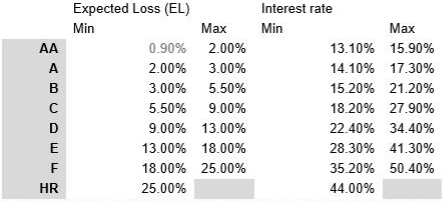
Announced new score classes with interest rates and expected losses. Source: Bondora newsletter
Bondora will in future set the interest rates of new loan applications according to the price bands for the new scores in the above table. However they have not started to do this yet and still apply the old pricing system while already displaying new score classes. This confused some investors initially.
Bondora also calculated the scores under the new model for the old existing loans. This calculation is based on the available application parameters of these old loans, NOT on loan performance since. While this also confused some investors it is useful as it gives some insight on how good the scoring model might be in predicting defaults.
I looked at my Estonian loans only (I have few loans in other countries therefore these would not have yielded an informative picture).
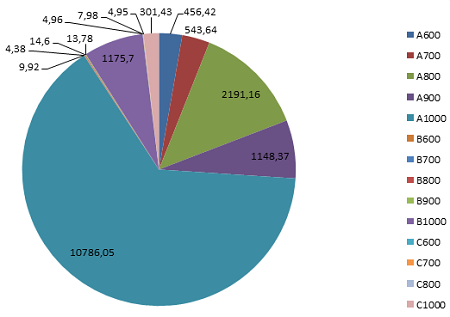
Chart 4: Allocation of my Estonian loans (outstanding principal amounts) under the old scoring system
Under the old scores I was mostly invested in A1000, A900, A800 and B1000. A indicates higher amount of discretionary income than B and C. 1000 is the best credit history. It is important to remember that it actually means no recorded payment problems in the past 3 years, so actually a borrower with no credit history is rated 1000 too. 900 – 600 mean payment issues in the past.
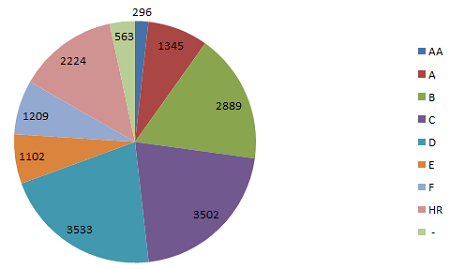
Chart 5: Allocation of my Estonian loans (outstanding principal amounts) under the new scoring system.
As you can see the new assigned scores for my existing Estonian loans are in majority B to D and also many HR loans.
I then compared the defaults by outstanding principal amounts under the old and new scoring model.
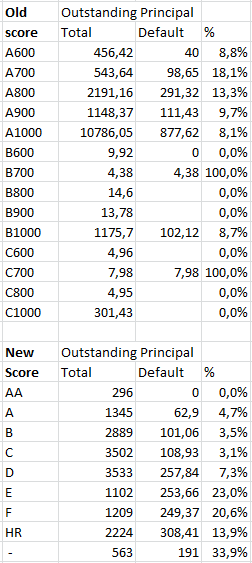
Comparision of distribution of defaults in my portfolio under old and new scoring system
On first impression the new scoring model does what it should – seperate the good risks from the bad risks. Loans now rated E, F and HR have much higher percentages of defaulted outstanding principal than those in score classes AA to D. I view that as a good sign for the future.
Here is what I personally did in reaction to the changes:
- I stopped all but one of my portfolio managers (I left one running for EE A1000) and concentrated on investing manually until the picture becomes clearer
- I invested heavily in hand-picked (strong emphasis on those with a mortgage) Estonian and Finnish loans under the new grades B-D with interest rates of 29-34%. My reasoning here is that under the new model comparable loans will be priced at 15% to 34% in a few weeks. That means I can either let them run enjoying the better interest rates or sell them on the secondary market at a high premium after the new pricing is implemented
- I bought a few non-overdue, non-rescheduled older Estonian loans now rated A to C at small premium (2% to 5%) on the secondary market
- I sold a few relatively new loans rated C or D at 5% to 9% premium on the resale
What did you do? Share your actions and reasoning in the forum.

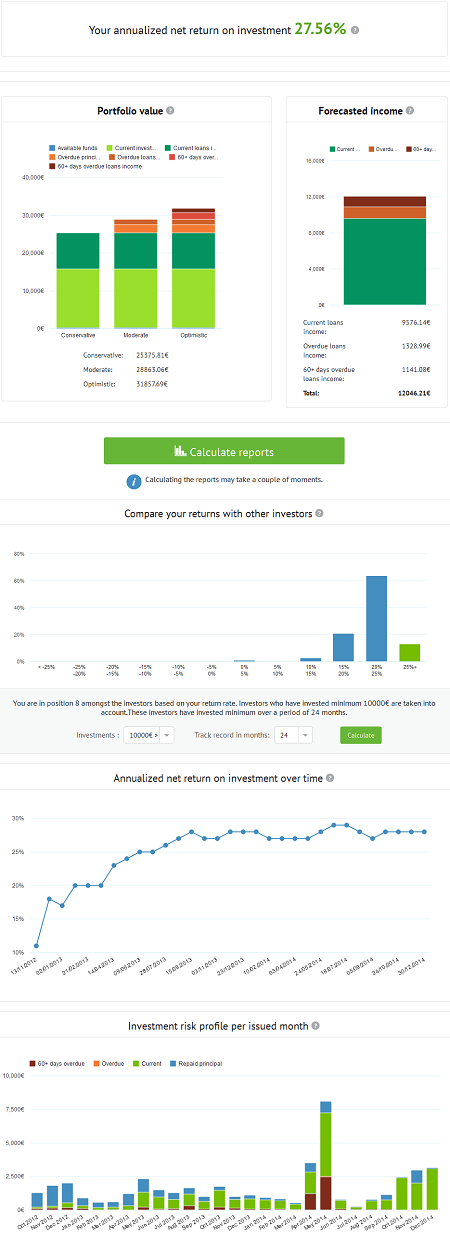
Chart 6: Statistics on ROI and funded volume

The new year will definitely be interesting! Many people have turned off their portfolio managers and I’ve gotten an insane amount of loans in the past week because of that. With many people likely to aim for high credit rating loans, then groups E, F & HR will be a potential source of high returns for those who pick them.
I also like getting B grade loans with 29-34% at the moment.
Claus, what is your view/prediction for the upcoming 2015? How will Bondora loans volume grow, will there be any complications regarding new Portfolio manager ant etc. ?
After reading all your posts I decided to give it a try and your will be my benchmark 🙂 I started just 2 weeks ago. Currently I invested 1000 EUR mostly to EST A1000, some of them I bought on SM May I ask you how you calculate your own ROI using XIRR in Excel? Because right now B shows me just terrible -83.45%. When I use all transactions and calculate ROI in Excel it is even worse -96.12%. But I suppose thats just because I invested all the money and except few cents nothing came back yet. Do you use for ROI all transactions which occurred? (transfers, fees, loans, etc.) Do you consider your transfers to B account be of positive value? I wanted to start with a negative value of my investment (it’s just sitting there even if it is not invested in any loans) but can’t calculate anything cuz I dont have almost any payments yet. B mentions they use Net Value of your portfolio but XIRR in Excel doesn’t use this parameter, so I really don’t know how they calculate it.
Thanks for an update. Your assumption of 70% recovery rate is rather optimistic, I personally apply 25% and 90% recovery rate for defaulted and overdue loans.
I decided to leave my old portfolio managers running as they are picking rather good quality loans (B,D,F,HR). I like to see stats before switching to the new system.
@Analitikas
Actually this assumption is currently not that important to me. Even if I calculate with 0% recovery for my 60+ days overdue loans, I still have a very, very good ROI.
Another point: Figures have shown that about 50% of overdues eventually go into 60+ days overdue. So if you use 25% recovery rate for 60+ days then assuming 90% recovery for overdues is optimistic too.
@Andrej
As you bought loans on the SM, you paid at least 1.5% (the transaction fee). As you do not have any earnings yet, this will automatically turn your ROI negative. Calculation with XIRR won’t produce any meaningful results in the first 1-2 months.
Regarding how to do it: I haven’t written about it in English, but maybe you can use my German article with Google Translate: http://www.p2p-kredite.com/rendite-des-invests-in-isepankur-kredite-mit-xintzinsfuss-excel-funktion-berechnen_2013.html
It is from 2013, a few things have changed, but you will get the general idea of the method
@Tauri
I sure hope Bondora will continue to grow
Thanks – that helps a lot. I didn’t know what type of transactions you include in XIRR but it seems very simple this way and it makes definitely better sense than using all transactions from account statement. You are right I already paid some fees cca – 10EUR, so my ROI is currently negative but I will follow up closely how it goes in the future. From today new PM is available, are you going to use it or not? If so, what approach are you going to use? It seems very risky to me invest to FIN, ESP and SVK loans and I really can’t comprehend why ESP loan “income not verified” can have C rating. Hopefully time will tell and it become much clearer in recent weeks.
My returns from an A1000 portfolio manager have dropped from 18% to 12% on Bondora’s figures, but another question is more urgent…
How do I write something sensible for an income tax return?
I know that some people might subtract losses and some not, but I can’t see how to get anything at all out of the system that looks half sensible on a tax return – just a load of excel files that I don’t understand!
@John, did you download the Income Report from Invest > My Investment > Data Export (Beta) ? That gives you the raw data.
What you do with that is dependand on the tax rules of your country of residence.
Only thing you might miss is the paid fees, which can be found for example in the monthly overview report that can be generated at the same location.