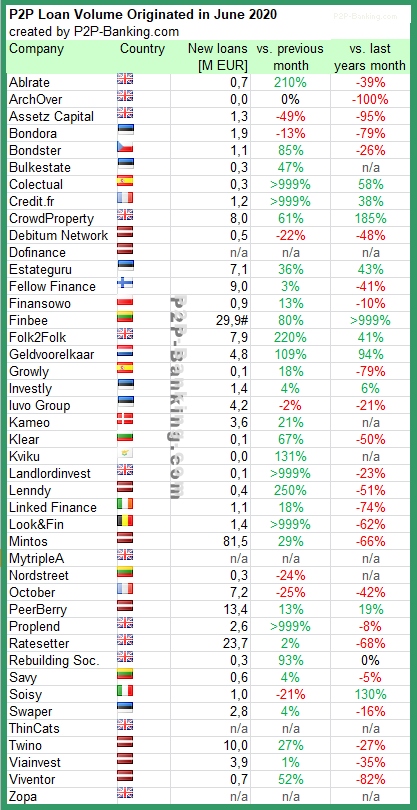
The table lists the loan originations of p2p lending marketplaces for last month. Mintos* leads ahead of Finbee* and Ratesetter*. The total volume for the reported marketplaces in the table adds up to 236 million Euro. I track the development of p2p lending volumes for many markets. Since I already have most of the data on file, I can publish statistics on the monthly loan originations for selected p2p lending platforms. This month I added Kviku*. I delisted Smartika as it does not seem to have originated any new loans for 5 month now.
Investors living in national markets with no or limited selection of local p2p lending services can check this list of international investing on p2p lending services. Investors can also explore how to make use of current p2p lending cashback offers available. UK investors can compare IFISA rates.

Table: P2P Lending Volumes in June 2020. Source: own research
#note: Finbee loans include SME support loans originated via the platform by the Lithuanian government
Note that volumes have been converted from local currency to Euro for the purpose of comparison. Some figures are estimates/approximations.
Links to the platforms listed in the table: Ablrate*, Archover*, Assetz Capital*, Bondora*, Bondster*, Bulkestate*, Colectual*, Credit.fr*, Crowdproperty*, Debitum Network*, Dofinance*, Estateguru*, Fellow Finance*, Finansowo*, Finbee*, Folk2Folk*, Geldvoorelkaar*, Growly*, Investly*, Iuvo Group*, Kameo*, Klear*, Kviku*, Landlordinvest*, Linked Finance*, Lenndy* Look&Fin*, Mintos*, MyTrippleA*, Nordstreet*, October*, Peerberry*, Proplend*, Ratesetter*, Rebuilding Society*, Savy*, Soisy*, Sourced*, Swaper*, TFGcrowd*, ThinCats*, Twino*, Viainvest*, Viventor*, Zopa*.
Notice to p2p lending services not listed:
For new companies a small listing fee applies. If you want to be included in this chart in future, please contact me for more information.
Notice to representatives of press/media: If you are interested in publishing a branded version of this table in your own layout/design, which will make a nice addendum to your coverage of p2p lending, please contact me.

Finbee data are not correct here. They present accumulated results here which is not the right fit in this comparison. Other platforms present the result of funded loans per month here
Hi Ruth,
I doublechecked with the Finbee management before publishing. The figure is correct (it is for one month). See footnote. A very large part of this loans are funded by the Lithuanian government.
In their website, they show that the total amount of loans granted is 23 010 630€, which means that it is from the beginning of their activities (you can see it here https://www.finbee.lt/), in another place in their website (here https://www.finbee.lt/investuok/) they show 30 429 825€ of the total amount of loans granted. So where is the truth?:) how can be 29,9 € millions in June, when the total amount of granted loans up to date is 30 429 825€?
Hi Ruth,
information from Finbee is:
In June lending volumes were:
Consumer loans – 764 TEUR
Business loans (funded by investors) – 459 TEUR
Business loans (funded by the government) – 28669 TEUR
I assume that their website statistic does not include the goverment funded loans, as they are a temporary measure and will end in July 2020.
ok, if it is so, I will ask in another way – other platforms present their data of loans funded by investors money per one month. Do you really think the State support is equal wight of data here to compare with others? And I still don’t understand why they don’t include it in their public statistics but feel fine to present it here
Hi Ruth,
I contemplated whether to include these loans in the statistic or not. I decided to include them as the volumes are an indicator (proxy) for platform company revenues and Finbee earns a fee for originating the government loans. Therefore for investors wanting to assess the financial situation of the platform companies I deem the information useful.
However as the unusual figure raises questions (it did already so last month), I decided to add a footnote to explain the effect that leads to this number.
Thank you for replying to my comments. I am demanding transparency of information because I am a representative of the independent business media. I cannot tolerate when I see comparing bananas to apples. Providing the comparison of data in such a way, you put readers to doubts about the reliability of the data. At least, you should indicate in the # notes the exact amount, what part of the amount is government support for SMEs, because in this case, it is an absolute exception to the norm compared to what you are comparing – the entire p2p market.
Ruth, I cannot tolerate people like you complaining.
Just contact the platforms and do the job yourself if you dont like the way is done here.
Could you please add Lendermarket and Moncera?