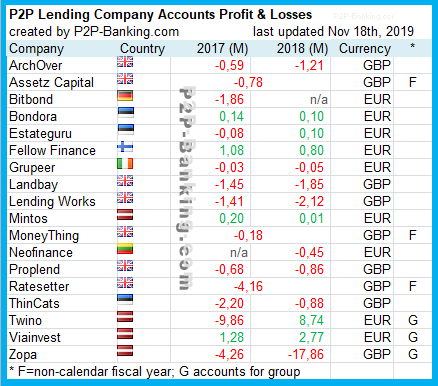
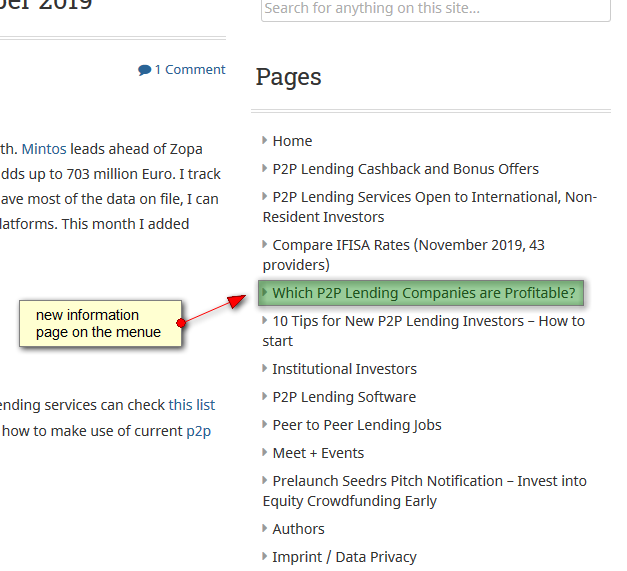
I added a new information page to P2P-Banking compiling data on which p2p lending marketplaces made a profit or a loss in the last business years. You can read more on why this data is useful to investors on the platforms here.
Snapshot of the table at the start of the data collection:

Table: Profits/losses of p2p lending companies (in million currency units) Source: own research.
The table will be updated and added to on this infomation page in future. P.S.: Thx to the crowd for emailing me additional data. Only a few hours after first publication I was already able to add more companies and data so the table on the information page is already more comprehensive than the outdate first version of the publication shown above.


Strange, I was actually looking for this info today and then comes your email!
It’s still difficult to make a call on how well a business is doing / risk of going into admin, as like you say, many of them are startups and reinvest profits.
Look at Zopa for example, they look like they are doing terribly, but they have put a lot of money into the new bank they are launching (£39.2m) which would explain the loss.
Best trying to stay up to date with each company you do P2P lending with, if big losses, wheres the money going.